Image Details

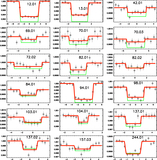
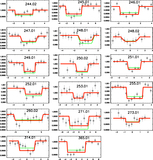
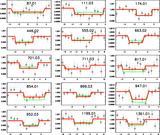
Caption: Figure 2.
Example of a Spitzer transit light curve observed in the IRAC band-pass at 4.5 μm: KOI-701.03. Top panel: raw (unbinned) transit light curve. The red solid line corresponds to the best-fit model, which includes the time and position instrumental decorrelations, as well as the model for the planetary transit (see details in Section 4). Bottom panel: corrected, normalized, and binned by 30 minutes transit light curve with the transit best fit plotted in red and the transit shape (with no limb darkening) expected from the Kepler observations overplotted as a green line. The two models agree at the 1σ level.
Other Images in This Article
Show More
Copyright and Terms & Conditions
© 2015. The American Astronomical Society. All rights reserved.