Image Details
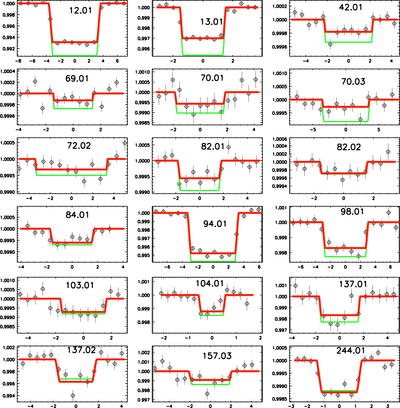
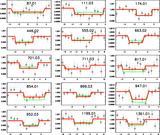
Caption: Figure 3.
Transit light curves from the Spitzer program 60028 (part-1/2). The light curves are obtained at 4.5 μm with the IRAC instrument aboard Spitzer. The data are corrected, normalized, binned in time, and combined (when multiple observations are available). The gray points are the measurements with their 1σ error bars. The red solid lines correspond to the best-fit model of the Spitzer data (unbinned) as described in Section 4. The transit shapes expected from the Kepler observations are overplotted as green lines. The planetary transit models are computed neglecting the effect from stellar limb darkening. The names of the KOIs appear in each individual plot.
Other Images in This Article
Show More
Copyright and Terms & Conditions
© 2015. The American Astronomical Society. All rights reserved.