Image Details
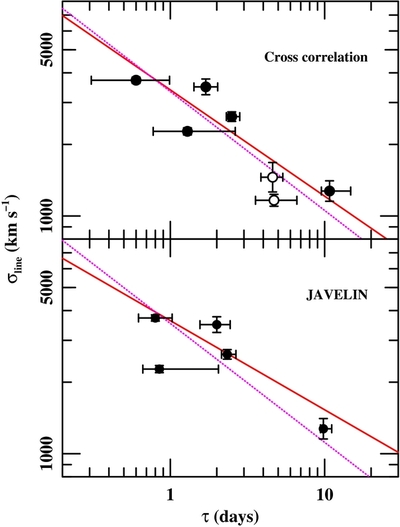
Caption: Figure 7.
Relationship between emission-line width and lag. The top panel shows the relationship between line dispersion in the RMS spectrum and cross-correlation centroid τcent. The open circles are lower-confidence measurements of the Hβ and Hα lines from the AGN Watch program in 1996. The red line is the fit to the relationship log σline = a + blog τ, which has slope b = −0.45 ± 0.05. The dotted magenta line is the best fit with a forced virial slope of b = −0.5. The bottom panel is exactly the same as the top panel, except that the time lags τ are from JAVELIN. The JAVELIN results for Hα and Hβ from the AGN Watch program are ambiguous and therefore not included. The best-fit slope for these data is b = −0.38 ± 0.06.
Other Images in This Article
Copyright and Terms & Conditions
© 2014. The American Astronomical Society. All rights reserved.