Image Details
Caption: Figure 6.
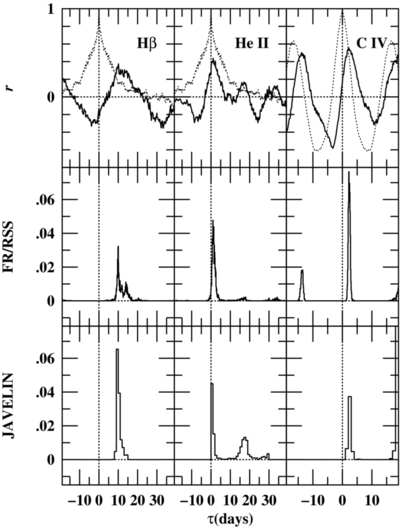
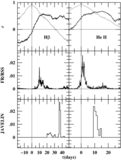
Time-series analysis results for Hβ (left column), and He II (middle column) based on the detrended light curves as shown in Figure 5 and for C IV λ1549 (right column) based on archival IUE data. The top row shows the cross-correlation functions; the solid black lines show the CCFs for each emission line, and the gray dashed lines show the continuum autocorrelation function. The middle row shows the cross-correlation centroid distribution from 1000 FR/RSS realizations. The bottom row shows the lag distribution from JAVELIN. The results for Hβ and He II should be compared with those shown in Figure 4. The results for the detrended light curves are far more consistent.
Other Images in This Article
Copyright and Terms & Conditions
© 2014. The American Astronomical Society. All rights reserved.