Image Details
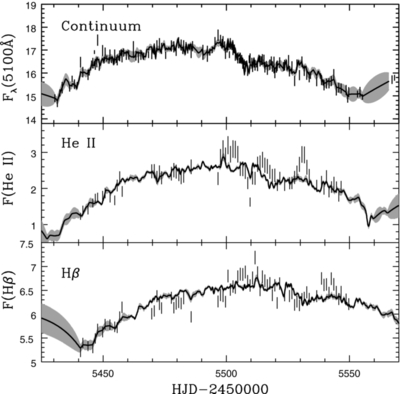
Caption: Figure 2.
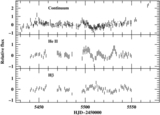
Combined light curves for NGC 7469, along with the JAVELIN models. The black vertical bars show the original data, and the solid black line shows the mean of the JAVELIN light curve models most consistent with the data. The gray shaded region shows the standard deviation of values about the mean. Continuum fluxes are in units of 10−15 erg s−1 cm−2 Å−1 and emission-line fluxes are in units of 10−13 erg s−1 cm−2.
Other Images in This Article
Copyright and Terms & Conditions
© 2014. The American Astronomical Society. All rights reserved.
Copyright ©
2026 Astronomy Image Explorer. All Rights Reserved.