Image Details
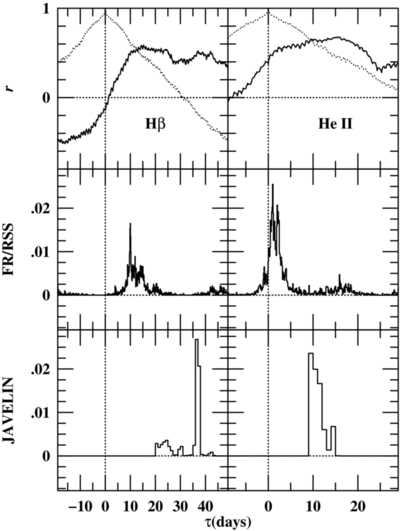
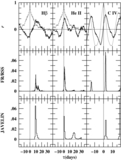
Caption: Figure 4.
Time-series analysis results for Hβ (left column) and He II (right column), based on the light curves given in Tables 1 and 2 and shown in Figure 2. The top row shows the cross-correlation functions; the solid black lines show the CCFs for each emission line, and the gray dashed lines show the continuum autocorrelation function. The middle row shows the cross-correlation centroid distribution from 1000 FR/RSS realizations. The bottom row shows the posterior lag distributions from JAVELIN. The cross-correlation functions have no clearly defined maxima and the JAVELIN and cross-correlation results are in poor agreement.
Other Images in This Article
Copyright and Terms & Conditions
© 2014. The American Astronomical Society. All rights reserved.