Image Details
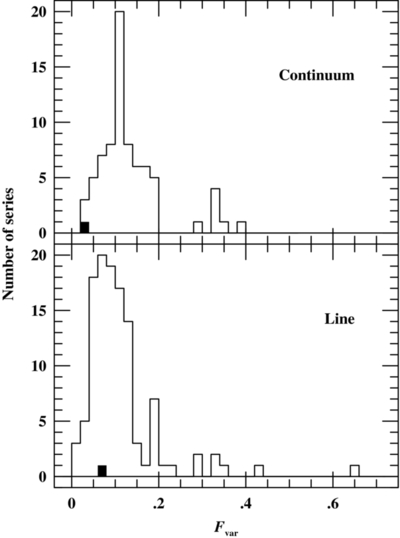
Caption: Figure 3.
Distribution of fractional variability measures Fvar for successful reverberation-mapping campaigns compiled by Peterson et al. (2004). The upper panel shows the continuum variations, usually in the optical and uncorrected for starlight contamination, and the lower panel shows line variations, usually for Hβ and uncorrected for narrow-line contamination. The values for the current campaign on NGC 7469, shown in black, indicate how comparatively little variability was detected in this campaign.
Other Images in This Article
Copyright and Terms & Conditions
© 2014. The American Astronomical Society. All rights reserved.
Copyright ©
2026 Astronomy Image Explorer. All Rights Reserved.