Image Details
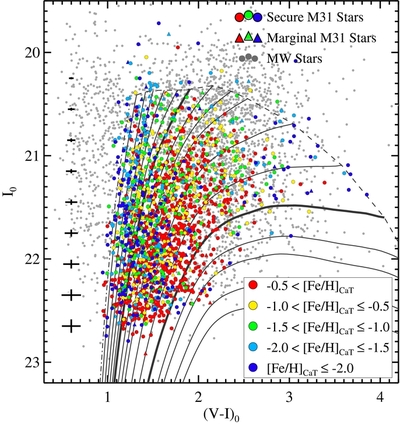
Caption: Figure 3.
Color–magnitude diagrams of spectroscopic targets with radial velocity measurements, color-coded according to spectroscopic metallicity measurements based on the equivalent width of the Ca II triplet. Typical photometric errors as a function of I magnitude are shown on the left. Gray curves represent isochrones for t = 10 Gyr and [α/Fe] =0.0, with the most metal-poor model having [Fe/H] =−2.3 (left) and the most metal-rich model having [Fe/H] =0.49 (right). The bold isochrones have metallicities of one-tenth Solar ([Fe/H] =−1.0) and Solar ([Fe/H] =0.0). Membership determination is performed using the Gilbert et al. (2006) diagnostic method, summarized in Section 2.3.
Other Images in This Article
Show More
Copyright and Terms & Conditions
© 2014. The American Astronomical Society. All rights reserved.