Image Details
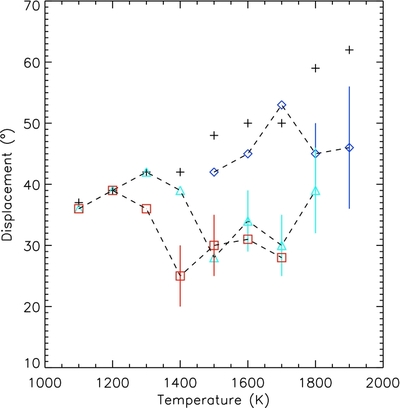
Caption: Figure 12.
Hot-spot displacement as a function of temperature. Black plus signs denote hydrodynamic models, blue diamonds represent 3 G magnetic models, cyan triangles represent 10 G models, and red squares represent 30 G models. Vertical lines represent the range over which the hot-spot displacement varies in 100Prot.
Other Images in This Article


Show More
Copyright and Terms & Conditions
© 2014. The American Astronomical Society. All rights reserved.
Copyright ©
2025 Astronomy Image Explorer. All Rights Reserved.