Image Details
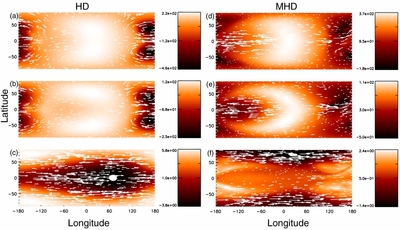
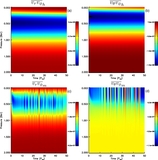
Caption: Figure 2.
Temperature perturbation (K), shown in color, and winds, shown with arrows as a function of longitude and latitude, for models M7 ((a)–(c)) and M7b2 ((d)–(f)) at 10 mbars ((a) and (d)), 70 mbars ((b) and (e)), and 10 bars ((c) and (f)).
Other Images in This Article

Show More
Copyright and Terms & Conditions
© 2014. The American Astronomical Society. All rights reserved.
Copyright ©
2025 Astronomy Image Explorer. All Rights Reserved.