Image Details

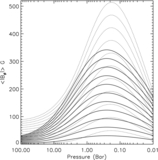
Caption: Figure 5.
Day–night temperature differential as a function of pressure. The solid line is the hydrodynamic version, dotted lines are 10 G MHD models, and dashed lines are 30 G MHD models. Red lines represent cool models, M2, M2b1, and M2b2, and black lines represent hot models, M7, M7b1, and M7b2.
Other Images in This Article


Show More
Copyright and Terms & Conditions
© 2014. The American Astronomical Society. All rights reserved.
Copyright ©
2025 Astronomy Image Explorer. All Rights Reserved.