Image Details
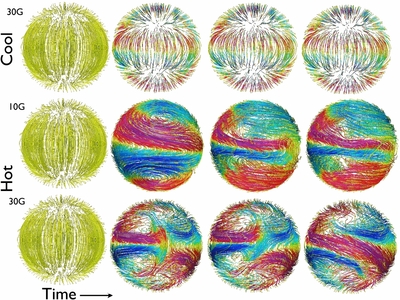
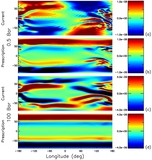
Caption: Figure 3.
Magnetic field evolution. The viewpoint is looking onto the nightside of the planet. Top row shows field lines for M2b2, with color representing the toroidal field magnitude, with red/magenta positive (with maximum of 5 G), blue negative (with minimum of −5 G), and yellow representing values between ±1 G. Middle and bottom rows show field lines for M7f1b1 and M7f1b2, respectively. Again, color represents toroidal field strength, with red/magenta positive with maximum of 260 G, blue negative with minimum −260 G, and yellow representing field strengths in the range ±20 G. Times are different for each model and are meant only to give a qualitative picture of magnetic field evolution.
Other Images in This Article


Show More
Copyright and Terms & Conditions
© 2014. The American Astronomical Society. All rights reserved.