Image Details
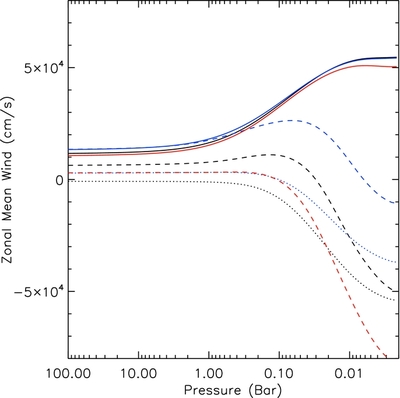
Caption: Figure 11.
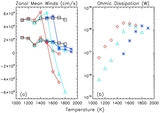
Zonal-mean zonal wind, averaged over low latitudes, as a function of pressure. Black lines represent model M7, blue lines represent M8, and red lines represent M6, with solid lines hydrodynamic models, dashed lines 10 G models, and dotted lines 30 G models.
Other Images in This Article


Show More
Copyright and Terms & Conditions
© 2014. The American Astronomical Society. All rights reserved.
Copyright ©
2025 Astronomy Image Explorer. All Rights Reserved.