Image Details
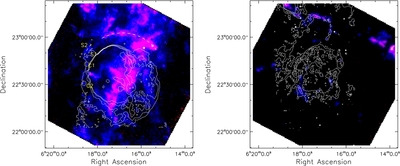
Caption: Figure 7.
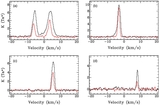
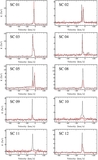
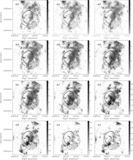
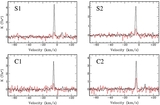
Left: the 12CO J = 1–0 (blue) and 13CO J = 1–0 (red) intensity maps in the −6 km s−1 to −1 km s−1 interval with the square root scale, overlaid with the 1.4 GHz radio continuum emission contours. The color scheme is adjusted to highlight the faint CO structures. The northern partial shell is denoted by the white dashed line. The northeastern partial shell structures (S1 and S2) and the eastern clumps (C1 and C2) are indicated in the image, the spectra of which are shown in Figure 8. The position–velocity map along the northern partial shell is shown in Figure 9. Right: 12CO (blue) and 13CO (red) intensity maps in the −9.2 km s−1 to −7.8 km s−1 interval with square root scale, overlaid with the Spitzer 24 μm mid-IR emission contours.
Other Images in This Article
Show More
Copyright and Terms & Conditions
© 2014. The American Astronomical Society. All rights reserved.