Image Details
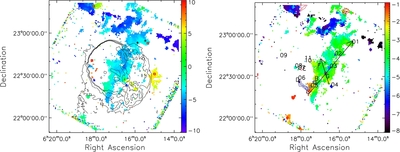
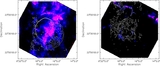
Caption: Figure 3.
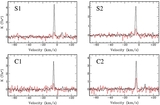
Left: the intensity weighted mean velocity (first moment) map of the 13CO (J = 1–0) emission in the interval of −10 km s−1 to 10 km s−1, overlaid with the 1.4 GHz radio continuum emission contours. The four small red boxes indicate the regions from which the typical spectra for the five MC components are extracted (see Figure 4). Right: the intensity weighted mean velocity (first moment) map of the 13CO emission in the interval of −8 km s−1 to −1 km s−1. The numbers 01–12 denote the location of the SCs identified by Lee et al. (2012). The letters B–G denote the location of the shocked clumps, and the blue and red contours show the blueshifted (−50 km s−1 to −9 km s−1) and redshifted (0–4 km s−1) components, respectively (see Figure 1, right panel).
Other Images in This Article
Show More
Copyright and Terms & Conditions
© 2014. The American Astronomical Society. All rights reserved.