Image Details
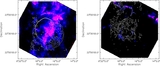
Caption: Figure 1.
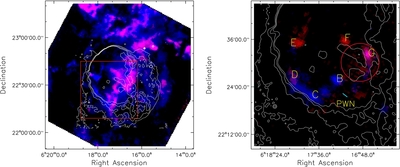
Left: 12CO (J = 1–0; blue) and 13CO (J = 1–0; red) intensity maps in the −10 km s−1 to 10 km s−1 interval with a square root scale toward SNR IC 443, overlaid with the 1.4 GHz radio continuum emission contours. The red box shows the area where the broadened molecular lines are detected (see right panel). Right: broadened 12CO (J = 1–0) integrated temperature map of SNR IC 443, overlaid with the 1.4 GHz radio continuum emission contours. The blue channel is in the −50 km s−1 to −9 km s−1 interval and the red is in the 0 km s−1 to 4 km s−1 interval. The letters B–G denote the location of the shocked clumps identified by Dickman et al. (1992). The red circle represents the location of the γ-ray source detected by VERITAS (Acciari et al. 2009), and the cyan line represents the location of the PWN detected by Chandra (Olbert et al. 2001).
Other Images in This Article
Show More
Copyright and Terms & Conditions
© 2014. The American Astronomical Society. All rights reserved.