Image Details
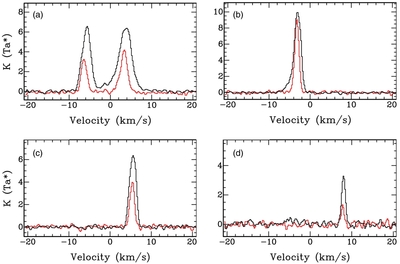
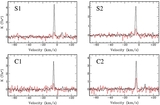
Caption: Figure 4.
Typical 12CO (J = 1–0; black) and 13CO (J = 1–0; red, multiplied by a factor of two) spectra of the different MC components showing peaks at (a) −7 km s−1 and 3 km s−1, (b) −3 km s−1, (c) 5 km s−1, and (d) 8 km s−1, respectively. The spectra extraction regions are indicated by the small red box in Figure 3.
Other Images in This Article
Show More
Copyright and Terms & Conditions
© 2014. The American Astronomical Society. All rights reserved.
Copyright ©
2025 Astronomy Image Explorer. All Rights Reserved.