Image Details
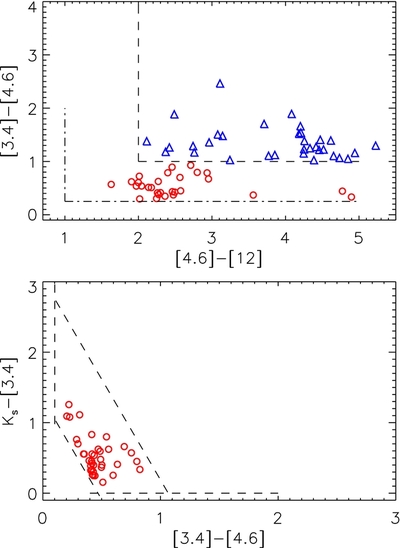
Caption: Figure 10.
Upper: WISE band 1, 2, and 3 color–color diagram showing the distribution of YSO candidates (Class II: 29 red circles, see ID 1–29 in Table 3; Class I: 33 blue triangles, see ID 30–62 in Table 3) in the field of view of SNR IC 443. Lower: 2MASS Ks and WISE band 1 and 2 color–color diagram showing the distribution of YSO candidates (Class II: 36 red circles, see ID 63–98 in Table 3) in the field of view of SNR IC 443.
Other Images in This Article
Show More
Copyright and Terms & Conditions
© 2014. The American Astronomical Society. All rights reserved.
Copyright ©
2025 Astronomy Image Explorer. All Rights Reserved.