Image Details
Caption: Figure 13.
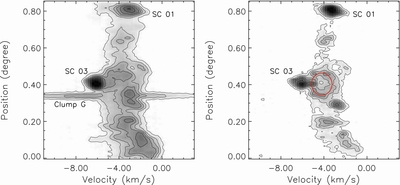
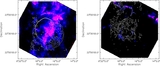
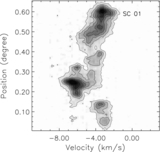
Left: position–velocity diagram of the 12CO emission along the southeast–northwest (see the long arrow in Figure 3). Clumps G, SC 03, and SC 01 are labeled in the diagram. Right: the 13CO emission along the southeast–northwest. The red ellipse indicates a ring structure with a radius of 3![]() 6.
6.
Other Images in This Article
Show More
Copyright and Terms & Conditions
© 2014. The American Astronomical Society. All rights reserved.
Copyright ©
2025 Astronomy Image Explorer. All Rights Reserved.