Image Details
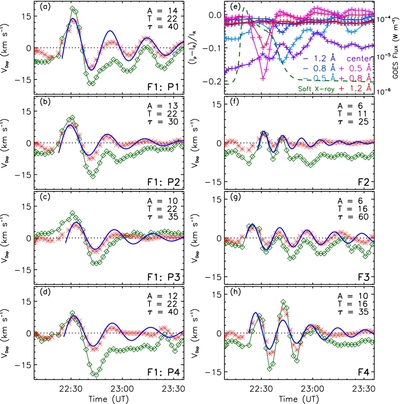
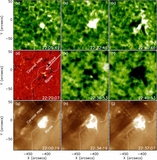
Caption: Figure 4.
Measurement of the Doppler velocity of the oscillating filaments. The Doppler velocities at the four points along F1 are shown in panels (a)–(d), while those for F2–F3 are plotted in panels (f)–(h), respectively. In each panel, the green curve with the diamond is the derived Doppler velocity, while the red curve with the asterisk is the detrended velocity obtained by subtracting the smoothed velocity using a 10 minutes boxcar. The blue curve is a fit to the detrended data points in a form of F(t) = Aexp (− t/τ)sin (ωt + ϕ). The velocity amplitude (A), oscillation period (T), and damping time (τ) are also plotted in the figure. Panel (e) is the plot of the intensity contrasts of the seven Hα wavelengths at P1, in which the green dashed curve is the GOES 1–8 Å soft X-ray flux.
Other Images in This Article
Copyright and Terms & Conditions
© 2014. The American Astronomical Society. All rights reserved.