Image Details
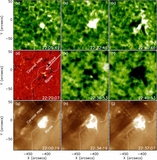
Caption: Figure 1.
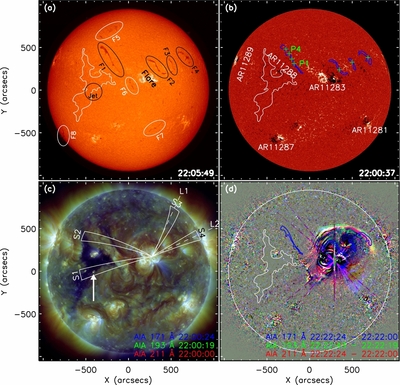
Overview of the event before the X2.1 flare. Panel (a) is a SMART Hα center image, in which the oscillating filaments are highlighted with black ellipses (F1–F4), while the white ellipses indicate the stable ones (F5–F8). The black circle indicates the jet, and the white contour marks the coronal hole boundary. Panel (b) is an HMI LOS magnetogram overlaid with contours of the coronal hole and the oscillating filaments. The green crosses in panel (b) are the position where Doppler velocities are measured. Panels (c) and (d) are raw and running-difference tri-color images in which the blue, green, and red color represent the AIA 171, 193, and 211 Å channels, respectively. The sectors (S1–S4) and the dashed lines (L1 and L2) in panel (c) are used to obtain time–distance plots. The white arrow points to the bright point at the jet base. The FOV of each frame is 2100'' × 2100''.
(Animations (a and b) and a color version of this figure are available in the online journal.)
The video/animation of this figure is available in the online journal.
Other Images in This Article
Copyright and Terms & Conditions
© 2014. The American Astronomical Society. All rights reserved.