Image Details

Caption: Figure 2.
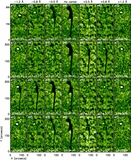
Time–distance plots show the detailed kinematics of the EUV wave along the four sectors and the two dashed lines shown in Figure 1(c). Panels (a)–(d) are obtained from 211 Å running-ratio images along sectors S1–S4, while panels (e) and (f) are along L1 and L2, respectively. The dashed (dotted) lines are linear (quadratic) fitting to the wave stripes. The arrow in panel (a) points to the jet, while those in panels (b) and (d) indicate the intensity fluctuation patches after the passage of the EUV wave. The green dashed lines in panels (e) and (f) indicate the limb of the solar disk.
Other Images in This Article
Copyright and Terms & Conditions
© 2014. The American Astronomical Society. All rights reserved.
Copyright ©
2025 Astronomy Image Explorer. All Rights Reserved.