Image Details
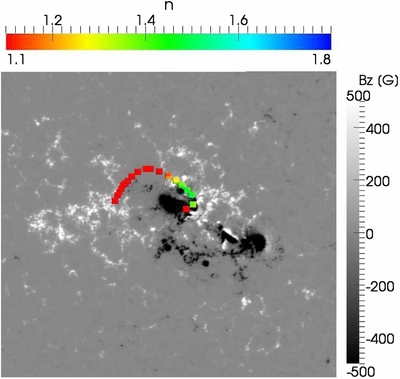
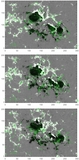
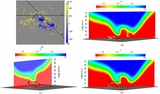
Caption: Figure 9.
HMI magnetograms of the active region taken on 2011 August 4 at 03:36 UT together with the reconstructed position of the filament on 2011 August 4 at 03:36 UT. The reconstructed filament is color-coded with the decay index computed from the potential field extrapolation. North is at the top; west is to the right.
Other Images in This Article
Copyright and Terms & Conditions
© 2014. The American Astronomical Society. All rights reserved.
Copyright ©
2026 Astronomy Image Explorer. All Rights Reserved.