Image Details
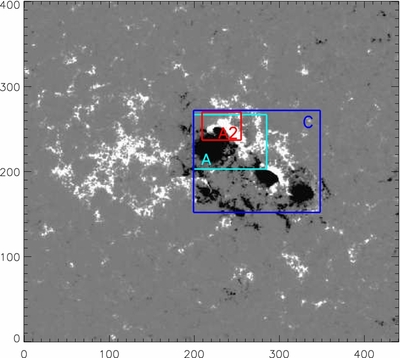
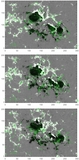
Caption: Figure 3.
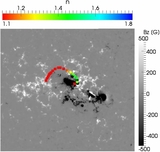
HMI magnetogram of the active region obtained on 2011 August 3 at 00:00 UT. The three squares indicate the three different regions discussed in the text. Region C is the region that includes the complete sunspot group. Region A is a zoom into the northern sunspot, while Region A2 is a zoom into the locations where the footpoints of the two filaments cross each other. The x and y scales are in image pixels. North is at the top and west to the right.
Other Images in This Article
Copyright and Terms & Conditions
© 2014. The American Astronomical Society. All rights reserved.
Copyright ©
2026 Astronomy Image Explorer. All Rights Reserved.