Image Details
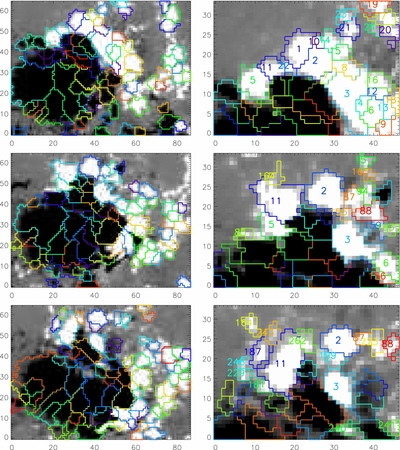
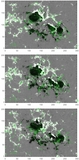
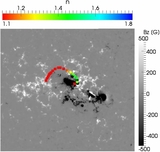
Caption: Figure 4.
Close up of the HMI magnetograms in Region A (left panels) and Region A2 (right panels) at different times: 2011 August 3 at 00:00 UT (top panels), August 3 at 18:00 (middle panels), and August 4 at 03:24 (bottom panels). The color contours highlight the features identified using the Yet Another Feature Tracking Algorithm. For clarity, we show only a sample of the magnetic feature labels: those corresponding to the positive flux in Region A2. The magnetic scale is saturated at ± 300 G. The x and y scales are in image pixels. North is at the top and west to the right.
Other Images in This Article
Copyright and Terms & Conditions
© 2014. The American Astronomical Society. All rights reserved.
Copyright ©
2026 Astronomy Image Explorer. All Rights Reserved.