Image Details
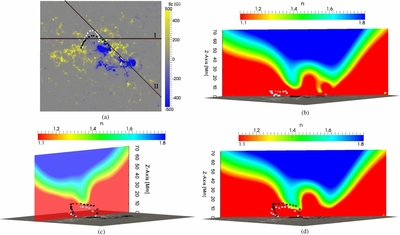
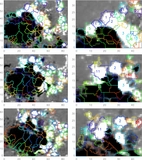
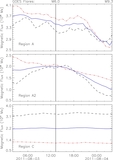
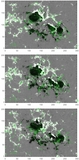
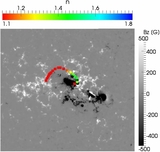
Caption: Figure 8.
(a) HMI magnetogram of the active region taken on 2011 August 4 at 03:36 UT. The two lines indicate the projections on the magnetogram of the two planes used to display the decay index. The white cubes indicate the reconstructed position of the filament on August 3 at 08:35 UT, while the black cubes highlight the reconstructed position of the filament on August 4 at 03:36 UT. (b) Plot of the decay index for the potential field extrapolation relative to the HMI magnetogram taken on August 3 at 06:00 UT. The decay index is plotted along the plane passing through line II of Figure (a), that is, along part of the axis of the reconstructed filament (white cubes). (c)–(d) Plot of the decay index for the potential field extrapolation relative to the HMI magnetogram from August 4 at 03:36 UT and along the planes passing through lines I and II of Figure (a). The white and black cubes highlight the three-dimensional position of the filament on August 3 at 21:36 UT and on August 4 at 03:36 UT, respectively.
Other Images in This Article
Copyright and Terms & Conditions
© 2014. The American Astronomical Society. All rights reserved.