Image Details
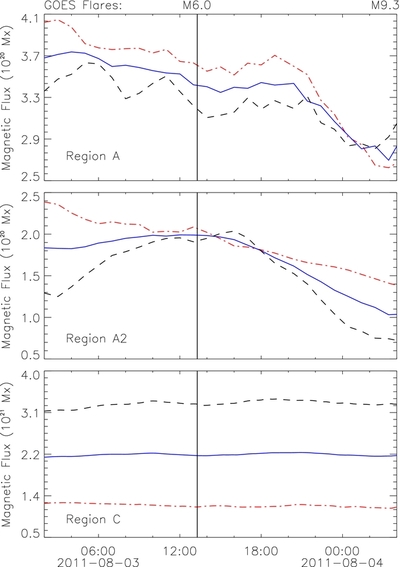
Caption: Figure 5.
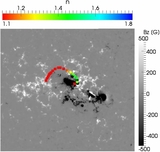
Time evolution of the positive (dash-dotted red), negative (dashed black), and total unsigned (solid blue) magnetic flux for Region A (top), Region A2 (middle), and Region C (bottom).
Other Images in This Article
Copyright and Terms & Conditions
© 2014. The American Astronomical Society. All rights reserved.
Copyright ©
2026 Astronomy Image Explorer. All Rights Reserved.