Image Details
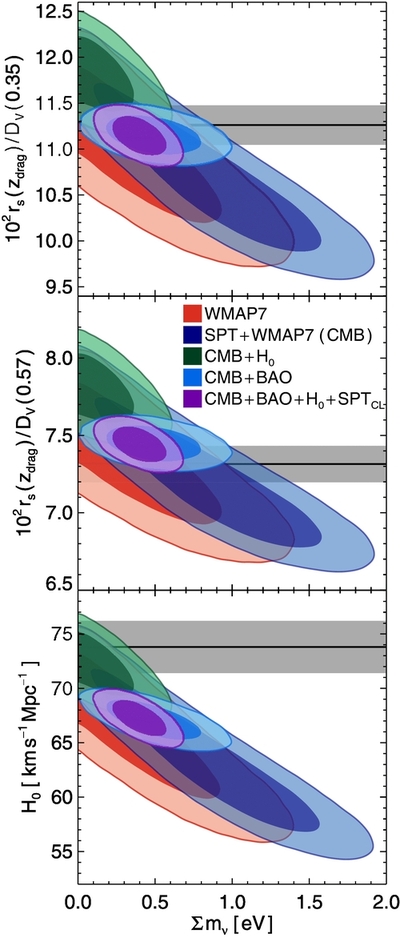
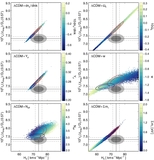
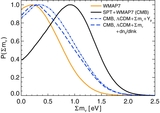
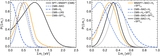
Caption: Figure 9.
This figure shows how low-redshift data sets affect the neutrino mass constraints. In the planes of ∑ m ν and three quantities inferred at low redshifts, we show the marginalized two-dimensional posteriors from different combinations of data sets shown by the legend in the central panel. Top: constraints are plotted in the ∑ m ν − r s ( z drag)/ D V (0.35) plane with the SDSS BAO data point shown by the gray band as the 1σ region. Middle: similar to the left panel but showing r s ( z drag)/ D V (0.57) with the BOSS BAO data point for the gray band as the 1σ region. Bottom: similar to the top and middle panels but showing H 0 with the gray band showing the 1σ region. The tension between BAO and H 0 can be seen in the three panels. The CMB+BAO preference for massive neutrinos is clearly visible.
Other Images in This Article
Show More
Copyright and Terms & Conditions
© 2014. The American Astronomical Society. All rights reserved.