Image Details
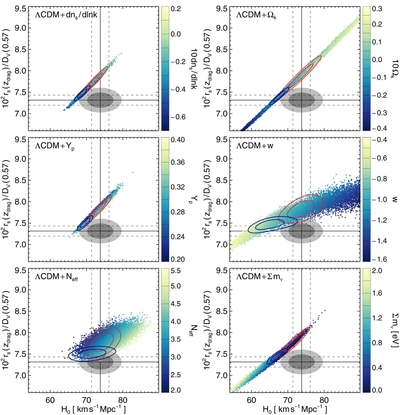
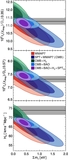
Caption: Figure 4.
This figure expands Figure 3 to investigate the consistency between the CMB, BAO BOSS, and H 0 data sets in one-parameter extensions to ΛCDM. Each panel shows the H 0 − r s / D V (0.57) plane for a different extension. The colored dots are samples drawn from the SPT+ WMAP 7 MCMC chain, with the color coding reflecting the value of the extension parameter, as shown in the color scales on the right. The horizontal solid and dashed lines mark the central value and 1σ region for the BAO BOSS measurement, while the vertical lines do the same for H 0. The joint 1 and 2σ likelihood region for BAO BOSS + H 0 measurements is denoted by the dark and light gray shaded contours. The blue (red) contours overlaid show the 68% and 95% confidence regions for CMB+BAO (CMB+ H 0). Varying the effective number of neutrino species leads to the best agreement between the CMB, BAO BOSS, and H 0.
Other Images in This Article
Show More
Copyright and Terms & Conditions
© 2014. The American Astronomical Society. All rights reserved.