Image Details
Caption: Figure 6.
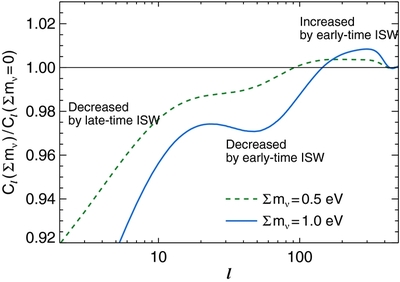
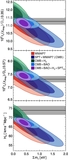
This figure shows the effects of massive neutrinos on the CMB power spectrum. The curves show the ratio of models with ∑
m
ν = 0.5 (dashed green) and 1.0 eV (solid blue), respectively, to the best-fit ΛCDM (∑
m
ν = 0 eV) model spectrum for SPT+
WMAP 7. When increasing ∑
m
ν we adjust
 downward to keep θ
s
fixed. On large scales, we see a reduction in the power added by the late-time ISW effect. On intermediate scales below the
neutrino free-streaming length, we see a reduction in the power contributed by the early ISW effect. On scales smaller than
the neutrino free-streaming length, the more rapid decay of gravitational potentials boosts the early ISW power. The amplitude
of the early ISW effect is damped at
l
downward to keep θ
s
fixed. On large scales, we see a reduction in the power added by the late-time ISW effect. On intermediate scales below the
neutrino free-streaming length, we see a reduction in the power contributed by the early ISW effect. On scales smaller than
the neutrino free-streaming length, the more rapid decay of gravitational potentials boosts the early ISW power. The amplitude
of the early ISW effect is damped at
l
![]() 500 by averaging over multiple positive and negative contributions.
500 by averaging over multiple positive and negative contributions.
Other Images in This Article
Show More
Copyright and Terms & Conditions
© 2014. The American Astronomical Society. All rights reserved.