Image Details
Caption: Figure 10.
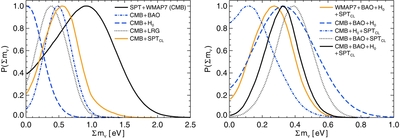
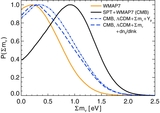
Left panel: this panel demonstrates how the marginalized one-dimensional posterior distribution of ∑
m
ν changes when a single external data set is
added to the CMB data set. The CMB constraint is shown by the black solid line. The data sets added are the BAO data (blue dot-dashed
line),
H
0 measurement (blue dashed line), LRG sample (black dotted line), and SPT cluster data (orange solid line). Right panel: this
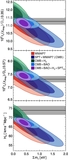
panel demonstrates how the marginalized one-dimensional posterior distribution of ∑
m
ν changes when a single external data set is
removed from the combination of CMB+BAO+
H
0 +
 . The data sets dropped are the SPT bandpowers (orange solid line),
 (blue dashed line), BAO data (blue dot-dashed line), and
H
0 measurement (black dotted line). The marginalized posterior for the combined CMB+BAO+
H
0 +
(blue dashed line), BAO data (blue dot-dashed line), and
H
0 measurement (black dotted line). The marginalized posterior for the combined CMB+BAO+
H
0 +
 data set is shown by the black solid line.
Other Images in This Article
Show More
Copyright and Terms & Conditions
© 2014. The American Astronomical Society. All rights reserved.