Image Details
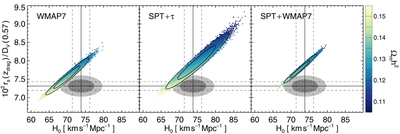
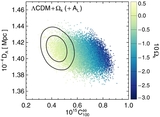
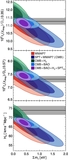
Caption: Figure 3.
Here we illustrate the degree of consistency between the CMB data and the two external data sets which are in the most tension: BOSS and H 0. The solid lines mark the 1 and 2σ contours from the CMB data in the H 0 − r s / D V (0.57) plane, while the color encodes the value of Ω m h 2, as shown in the color scale on the right. From left to right, the CMB data used is WMAP 7, SPT+τ, and SPT+ WMAP 7. The horizontal solid and dashed lines mark the central value and 1σ region for the BOSS BAO measurement, while the vertical lines do the same for H 0. The joint 1 and 2σ likelihood regions for BOSS+ H 0 measurements are denoted by the dark and light gray shaded contours.
Other Images in This Article
Show More
Copyright and Terms & Conditions
© 2014. The American Astronomical Society. All rights reserved.