Image Details
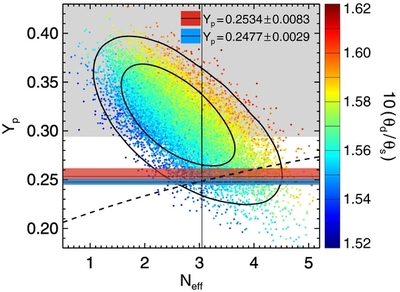
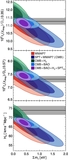
Caption: Figure 17.
This plot contrasts the CMB-derived two-dimensional likelihood contours for N eff and Y p with the predictions of BBN and other Y p measurements. The black solid contours are the 68% and 95% confidence intervals for SPT+ WMAP 7. The scattered points are samples from the Markov chain with the color encoding the value of θ d /θ s . The dashed black curve marks the standard BBN relationship between N eff and Y p . Similar to the right panel of Figure 15, the gray area is ruled out by the 95% upper limit of the measurement of solar initial helium abundance by Serenelli & Basu (2010). The Y p measurement from spectral observations of extragalactic low-metallicity ionized gas clouds by Peimbert et al. (2007) and Aver et al. (2012) are shown by the light blue and red bands respectively.
Other Images in This Article
Show More
Copyright and Terms & Conditions
© 2014. The American Astronomical Society. All rights reserved.