Image Details
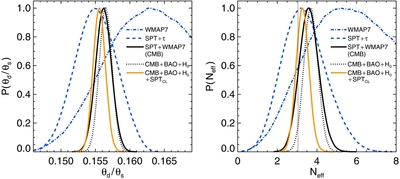
Caption: Figure 14.
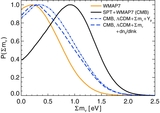
Marginalized one-dimensional posteriors for θ d /θ s (left) and N eff (right) from various combinations of data sets. The constraint on N eff in the ΛCDM+ N eff model for different combinations of data sets can be interpreted from the corresponding θ d /θ s posterior. The shift in θ d /θ s between broad WMAP 7 (dot-dashed blue curve) and SPT (dashed blue curve) implies a preference for lower N eff with SPT than WMAP 7. The N eff posterior of SPT+ WMAP 7 is shown by the solid black curve. The tighter constraints on N eff can be obtained by adding BAO and H 0 (black dotted curve) and combining CMB, BAO, H 0 and SPT SZ-selected clusters (solid orange curve).
Other Images in This Article
Show More
Copyright and Terms & Conditions
© 2014. The American Astronomical Society. All rights reserved.