Image Details
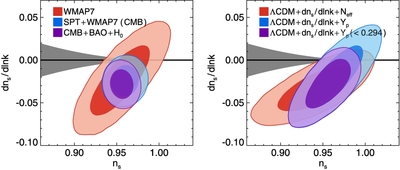
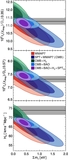
Caption: Figure 12.
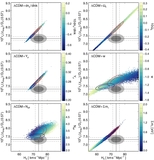
Data prefer negative running; this preference remains when additional parameters are freed. We show the marginalized two-dimensional posteriors for n s (at k = 0.025 Mpc −1) and dn s / dln k. Left panel: the n s − dn s / dln k joint distribution in the ΛCDM+ dn s / dln k model for different combinations of the data sets. Right panel: the n s − dn s / dln k joint distribution obtained by marginalizing N eff (red) and Y p (blue) for WMAP 7 +SPT data. The purple filled contours show the case with Y p marginalized with the prior Y p < 0.294, the 2σ upper limit of the solar initial helium abundance by Serenelli & Basu (2010). We show the region where | dn s / dln k| < (1 − n s ) 2 in gray. Inflation models with slow-roll expansion that can be terminated at second order make predictions in this region.
Other Images in This Article
Show More
Copyright and Terms & Conditions
© 2014. The American Astronomical Society. All rights reserved.