Image Details
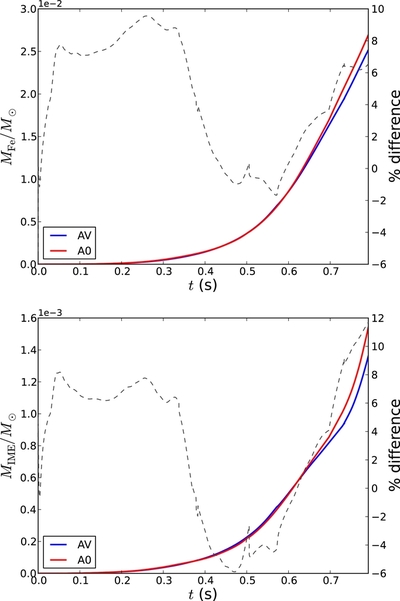
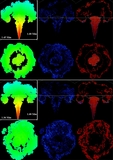
Caption: Figure 10.
Nucleosynthetic yields (left axes) and percent difference (right axes) as a function of time for Models AV (blue) and A0 (red). The top plot shows the production of iron-group material, and the bottom panel shows IME. The percent differences are formulated such that a positive value indicates more production in Model A0 than Model AV. In general, the model without the background flow field (A0) burns more IME and iron-group material.
Other Images in This Article
Show More
Copyright and Terms & Conditions
© 2014. The American Astronomical Society. All rights reserved.
Copyright ©
2025 Astronomy Image Explorer. All Rights Reserved.