Image Details
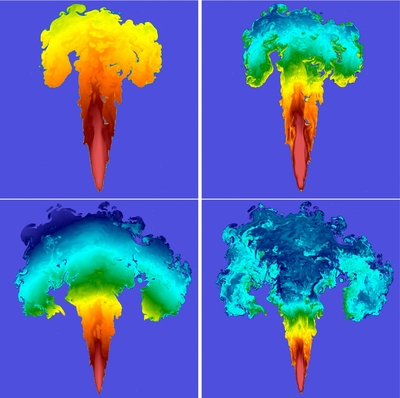
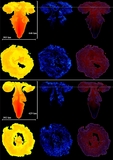
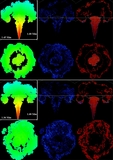
Caption: Figure 12.
T 9 = T/10 9 K (left column) and X( 4He) (right column) at t = 0.65 s (top row) and t = 0.8 s (bottom row) for the standard run AV. The color maps increase from blue to red; for T 9 the range is [2, 9] and for X( 4He) the range is [0, 0.25]. The frames in the top row are 1200 km on a side and those in the bottom row are 2000 km on each side. Note the high degree of correlation between the temperature and helium abundance. In high density regions—either at early times, or in the tail of the flame—large amounts of helium (right column) are produced via photodisintegration reactions because of the high temperature there. At lower density and temperature, recombination occurs leading to a lower helium mass fraction and more tightly bound nuclei (Figure 11). As the flame progresses to lower densities (bottom row), the temperature in the ash decreases and helium recombines giving extra energy to the ash.
Other Images in This Article
Show More
Copyright and Terms & Conditions
© 2014. The American Astronomical Society. All rights reserved.