Image Details
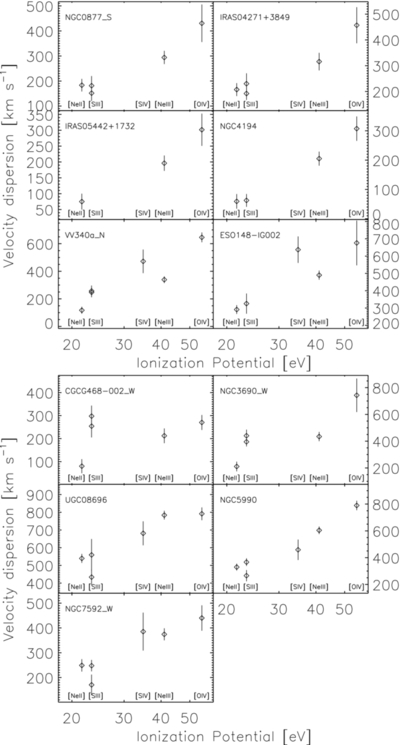
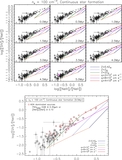
Caption: Figure 9.
Line width (corrected for the intrinsic velocity dispersion) of each species as a function of the ionization potential. The presented six starburst- (the top panel) and five AGN-dominated sources (the bottom panel) show increasing velocity dispersion with ionization potential.
Other Images in This Article


Show More
Copyright and Terms & Conditions
© 2013. The American Astronomical Society. All rights reserved.
Copyright ©
2025 Astronomy Image Explorer. All Rights Reserved.