Image Details
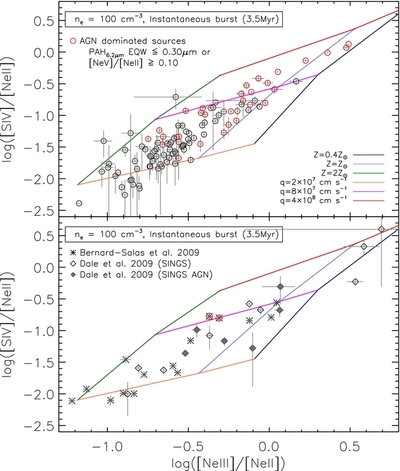
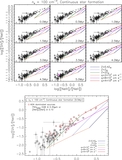
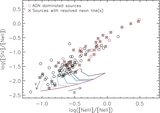
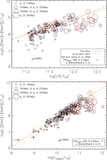
Caption: Figure 3.
Top panel: the same as Figure 2, but only the 3.5 Myr starburst model is shown against the GOALS data. Red circles represent the AGN-dominated sources with 6.2 μm PAH EQW ⩽0.3 μm or [Ne v]/[Ne ii] ⩾0.1. Bottom panel: the same as the top panel, but the data points are from Bernard-Salas et al. (2009) and Dale et al. (2009) shown as the asterisks and the diamonds, respectively. Among the sources of Dale et al. (2009), the AGN sources, classified by Moustakas et al. (2010) based on optical spectra, are indicated by the filled diamonds.
Other Images in This Article

Show More
Copyright and Terms & Conditions
© 2013. The American Astronomical Society. All rights reserved.
Copyright ©
2025 Astronomy Image Explorer. All Rights Reserved.