Image Details
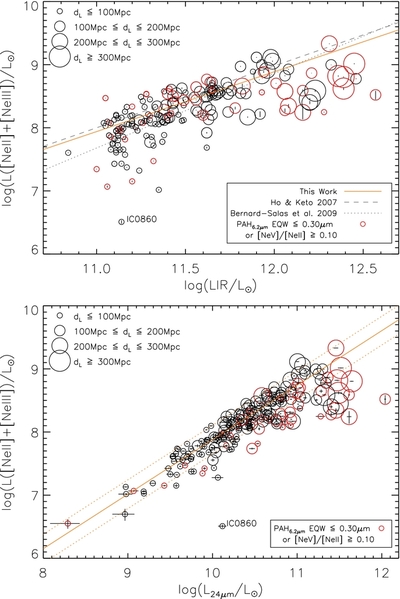
Caption: Figure 10.
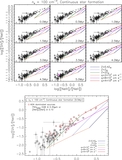
Top: the total luminosity of the [Ne ii] and [Ne iii] lines as a function of the infrared luminosity. Note that the luminosities
of these neon lines of each source in a single system are summed for the comparison with the
L
IR. The AGN-dominated sources (PAH
6.2 μm EQW ⩽0.3 μm or [Ne v]/[Ne ii] ⩾1.0) are shown in the red circles. The luminosity distances of sources are denoted by symbol
sizes (larger circle is more distant objects). The orange solid line represents the best fit line when only the starburst-dominated
sources are considered. The best fit lines of the
L
Ne vs.
L
IR relation estimated by Ho & Keto (2007) and Bernard-Salas et al. (2009) are also plotted in the gray dashed and dotted lines,
respectively. Bottom: the luminosities of
 vs. the synthetic 24 μm luminosities. The 24 μm luminosities are measured in the LH spectra. The correlation line and its
1σ dispersion are represented by the orange solid and dotted lines, respectively.
vs. the synthetic 24 μm luminosities. The 24 μm luminosities are measured in the LH spectra. The correlation line and its
1σ dispersion are represented by the orange solid and dotted lines, respectively.
Other Images in This Article


Show More
Copyright and Terms & Conditions
© 2013. The American Astronomical Society. All rights reserved.