Image Details
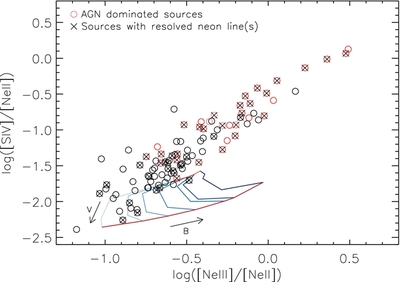
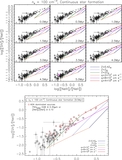
Caption: Figure 7.
Same line ratio diagram as Figure 3, but with the shock model grids (Allen et al. 2008) superposed. The AGN-dominated sources (PAH 6.2 μm EQW ⩽0.3 μm or [Ne v]/[Ne ii] ⩾1.0) are indicated with the red circles. The black crosses (×) denote the sources with at least one of the neon lines having a line width (FWHM) of >600 km s −1 (see also Section 4.2.2 and Figure 15 for details). The parameters of shock velocities V and the magnetic fields B increase with the directions of the arrows, in steps of 100, 200 km s −1 (the pink and red lines, respectively) and 1, 5, 10, 20, 40, 50, 100 μG (from the light blue to the dark blue lines), respectively.
Other Images in This Article


Show More
Copyright and Terms & Conditions
© 2013. The American Astronomical Society. All rights reserved.