Image Details
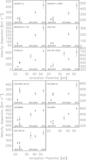
Caption: Figure 2.
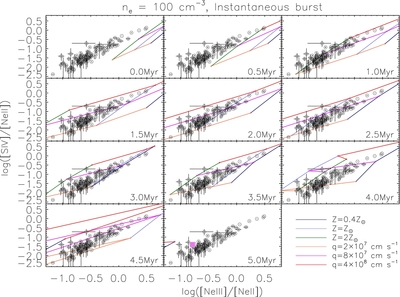
[S iv]/[Ne ii] vs. [Ne iii]/[Ne ii] line flux ratio plots for the GOALS sample compared with an instantaneous starburst model
assuming an electron density of
n
e
= 10
2 cm
−3. The age evolution of the line ratios is shown from the top left to the bottom right panels in 0.5 Myr steps. The parameters
of the model are age (indicated in each panel), metallicity (dark blue:
Z = 0.4
Z
☉, light blue:
Z =
Z
☉, green:
Z = 2
Z
☉), and ionization parameter (orange:
q = 2 × 10
7 cm s
−1, magenta:
q = 8 × 10
7 cm s
−1, red:
q = 4 × 10
8 cm s
−1). The pink filled square in the last panel denotes the median values of
 and
and
 , for the entire sample, including those sources with solid Ne line detections but no [S iv], and therefore it is not located
at the center of the points in the plot (which only include sources with solid [S iv] detections).
, for the entire sample, including those sources with solid Ne line detections but no [S iv], and therefore it is not located
at the center of the points in the plot (which only include sources with solid [S iv] detections).
Other Images in This Article


Show More
Copyright and Terms & Conditions
© 2013. The American Astronomical Society. All rights reserved.