Image Details
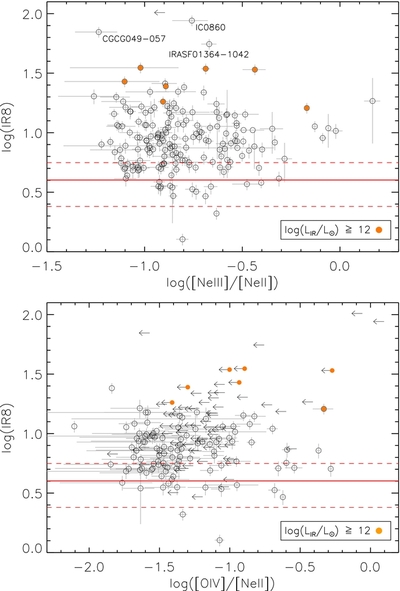
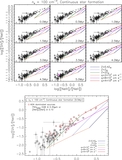
Caption: Figure 12.
IR8 ( L IR/ L 8 μm) vs. [Ne iii]/[Ne ii] (top) and [O iv]/[Ne ii] (bottom). Only starburst-dominated LIRGs are shown in these figures. The left-facing arrows indicate upper limits of the line ratios. The orange filled symbols are ULIRGs. When a system has multiple nuclei, the L IR is divided proportionally to the fraction of their MIPS 70 μm emission. When the MIPS 70 μm image is not available, the 24 μm emission is used instead. These figures do not include four nuclei in two systems, MCG+02-20-003 and VV 250a, whose MIPS 24 μm images are not available.
Other Images in This Article


Show More
Copyright and Terms & Conditions
© 2013. The American Astronomical Society. All rights reserved.
Copyright ©
2025 Astronomy Image Explorer. All Rights Reserved.