Image Details
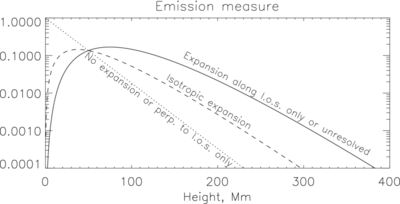
Caption: Figure 20.
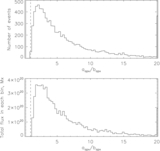
Model of how the emission measure scales with height for the flux tubes in Figure 19. The functions plotted are n 2 (dotted line), n 2 B −1/2 (dashed line), and n 2 B −1 (solid line). We assume a hydrostatic atmosphere n∝exp (− z/ z 0) with z 0 = 50 Mm for all curves and the field strength dropping like that of a point dipole, B( z) = z 0/ z 3 (the constant for B is chosen such that all three curves intersect at one density scale height).
Other Images in This Article

Show More
Copyright and Terms & Conditions
© 2013. The American Astronomical Society. All rights reserved.
Copyright ©
2025 Astronomy Image Explorer. All Rights Reserved.