Image Details
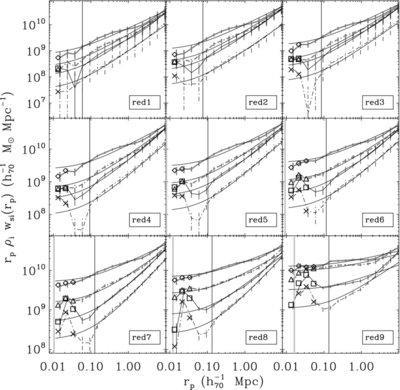
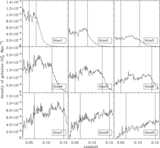
Caption: Figure 10.
Projected two-dimensional cross-correlation functions ρ i w p( r p) between all of the nine red spectroscopic subsamples and all red imaging subsamples, scaled by r p for better illustration. The right vertical thin lines are corresponding to 55 arcsec at the median redshift of the spectroscopic galaxies, and the left vertical thick lines are corresponding to the median r 90 for the spectroscopic galaxies. The error bars are from the jackknife error covariance matrix only. All the lines show the results after photometry correction: the thick solid line shows imaging galaxies with 10 −0.5 < M i/ M s < 10 0 (black diamonds are the result before photometry correction), the thick dashed line shows 10 −1 < M i/ M s < 10 −0.5 (black triangles are the result before photometry correction), the thin solid line shows 10 −1.5 < M i/ M s < 10 −1 (black squares are the result before photometry correction), and the thin dashed line shows 10 −2 < M i/ M s < 10 −1.5 (black crosses are the result before photometry correction). The four curves are the fit lines (see the text). The results before photometry correction are offset by 12% of our interval to the left.
Other Images in This Article
Show More
Copyright and Terms & Conditions
© 2012. The American Astronomical Society. All rights reserved.