Image Details
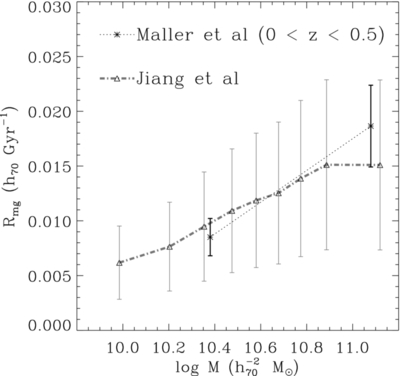
Caption: Figure 25.
Comparison of our merger rates (per galaxy h 70 Gyr −1) under assumption of t merge = t KW, i at 0.03 < z < 0.15 with the merger rates of Maller et al. (2006) at 0 < z < 0.5. The open triangles on the dashed lines are our results, and the thin dotted lines are the best-fit result calculated from Equation (5) of Maller et al. (2006). Both of our mass ratios are m/ M > 0.5. Please note that the results of Maller et al. (2006) are estimated from a flat Ω m = 0.4 cosmology with σ 8 = 0.8, a Hubble constant H 0 ≡ 100 h km s −1 Mpc −1 with h = 0.65, a baryon content Ω b = 0.047, and a spectral index n = 0.93. This difference of the two assumptions might lead to the difference of the two slopes.
Other Images in This Article
Show More
Copyright and Terms & Conditions
© 2012. The American Astronomical Society. All rights reserved.