Image Details
Caption: Figure 23.
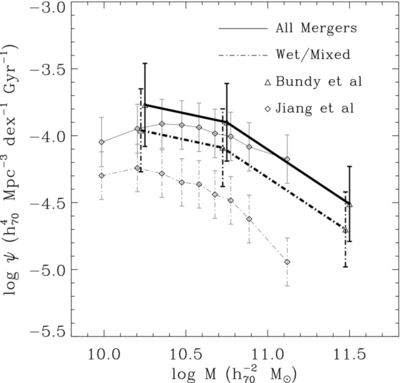
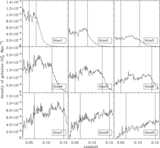
Comparison of our major merger rate MF at 0.03 < z < 0.15 under assumption of t merge = t KW, i with the major merger rate MF of Bundy et al. (2009) at 0.4 < z < 0.7. Both of our mass ratios are m/ M > 0.25. The open diamonds on the thick lines are our results, and the open triangles on the thin lines are the results of Bundy et al. (2009). The dashed lines show the results of excluding the approximate fraction of dry E/S0–E/S0 mergers, and the solid lines indicate the observed merger rate for all galaxies determined.
Other Images in This Article
Show More
Copyright and Terms & Conditions
© 2012. The American Astronomical Society. All rights reserved.
Copyright ©
2025 Astronomy Image Explorer. All Rights Reserved.