Image Details
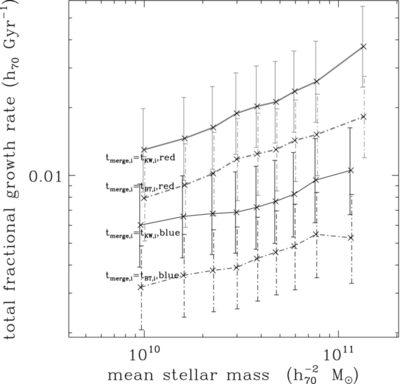
Caption: Figure 19.
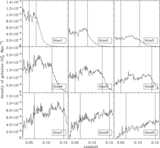
Total fractional accretion rates for each of the 18 spectroscopic subsamples h 70 Gyr −1 integrating over all the galaxies from the imaging sample. The thick lines are for the red spectroscopic subsamples and the thin lines are for the blue spectroscopic subsamples. The solid lines are for the merger rate under assumption of t merge, i = t KW, i , and the dashed lines are for the merger rate under assumption of t merge, i = t BT, i .
Other Images in This Article
Show More
Copyright and Terms & Conditions
© 2012. The American Astronomical Society. All rights reserved.
Copyright ©
2025 Astronomy Image Explorer. All Rights Reserved.