Image Details
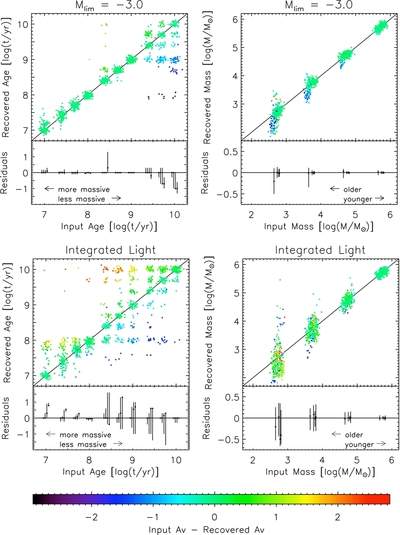
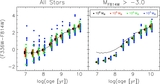
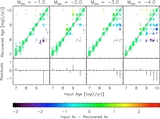
Caption: Figure 7.
Recovered vs. input age (left plots) and mass (right plots) of the simulated test clusters, color coded by the variation in recovered extinction. The top row shows the results from using unresolved light with M lim = −3, while the bottom row shows the results from using integrated light. We added Gaussian noise with a dispersion of σ = 0.05 dex in each direction for clarity. The bottom panels show the median (dot) along with the 16th and 84th percentile (bar) values of the residuals in log( t) and log( M), respectively. At each age time step, the age residuals are shown for each input mass, where the more massive clusters' residuals are shifted slightly to the left and those of the less massive clusters are shifted slightly to the right. The mass residuals are shown for four age groups (limits of 7.0, 7.5, 8.0, 8.5, 9.0), where the older clusters' residuals are shifted slightly to the left and the younger clusters' residuals are shifted slightly to the right.
Other Images in This Article

Copyright and Terms & Conditions
© 2012. The American Astronomical Society. All rights reserved.