Image Details
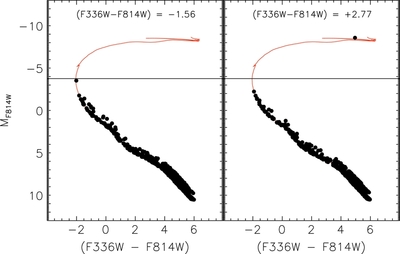
Caption: Figure 1.
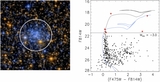
Simulated color–magnitude diagrams for two 10 Myr old, 10 3 M ☉ clusters at solar metallicity. Due to stochastic sampling of the initial mass function, the cluster in the left panel does not contain any evolved stars, while the cluster on the right has one evolved red giant. Integrated colors are included for each panel, along with a 10 Myr isochrone, and a horizontal line showing the magnitude of the main-sequence turnoff.
Other Images in This Article
Copyright and Terms & Conditions
© 2012. The American Astronomical Society. All rights reserved.
Copyright ©
2025 Astronomy Image Explorer. All Rights Reserved.